
“Do not buy the hype from Wall Street and the press that stocks always go up. There are long periods when stocks do nothing and other investments are better.” - Jim Rogers
When most people think of investing, they think of stocks and the stock market. There are a number of reasons for this. For one, stocks receive a disproportionately large amount of media attention and there is much hype and mysticism surrounding stock trading. Another reason is that stocks, as measured by the US S&P 500 index, have outperformed almost all other asset classes over the last 50 years. But it is important to understand that stocks are only one of the many places where you can invest/allocate your money. Also, it is necessary to take the hype and emotion out of investing as these two factors are why many people lose money in the stock market and other markets.
This blogpost will focus on explaining stocks. I will cover the basics and provide you with resources that you can utilize to dive deeper into this subject. Please keep in mind that it's impossible for me to convey a decade of learning and knowledge in a single blogpost. I encourage everyone to spend a considerable amount of time learning the markets before starting to invest. I do offer personalized financial education and training so please feel free to contact me for more information.
Please be sure to read my previous posts in my Personal Finance Series to find out if investing is the right thing for you at this point in your life.
What Is A Stock?
A stock is an ownership claim in the assets and earnings of a specific company. Both public and private companies can offer stock. However, the stocks that can be bought and sold on the stock market by the average investor are from public companies only. Some examples of public companies are Apple, Amazon, Facebook, Walmart, etc. Some examples of private companies include Uber, Koch Industries, Cargill Inc., etc. Unless stated otherwise, the term stock will refer to public company common stock for the remainder of this post.
Analyzing a Single Stock
I will walk you through the characteristics of stocks by analyzing a single stock. We will use Apple Inc as our example as most people are familiar with the Apple brand. You can access information about stocks from many sources on the internet, but to get a quick overview, my favorite sites are google.com/finance and yahoo.com/finance. For this example I will be using data from nasdaq.com.
The Stock Ticker Symbol
A ticker is an abbreviation for the full company's name and is generally between 1-4 characters. Apple Inc has the ticker symbol AAPL. The ticker is used to buy/sell the stock of a company on an exchange (stock market). For example, if you were to enter an order to purchase Apple Inc stock, you would input “AAPL” as the stock name/symbol/ticker. You can find the ticker symbol of any publicly-traded company by searching the company name on google.com/finance. If you're interested in the history of the ticker symbol, you can read about it here, but it has no real relevance for stock trading.
The Stock Price
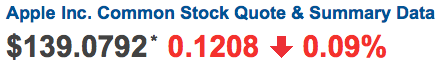
The stock price shows you the mid-price of a single share of stock, denoted in US dollars, for a specific time. In our example with AAPL, the current stock price is $139.0792 per share (stock and share are often used interchangeably). The stock price can/will fluctuate continuously throughout the trading day. Trading days in the US are Mon-Fri from 09:30-16:00 EST. If you would like to check if the US stock market is currently open or if it will be open on a particular day, you can visit isthemarketopen.com.
Two Prices for Every Stock
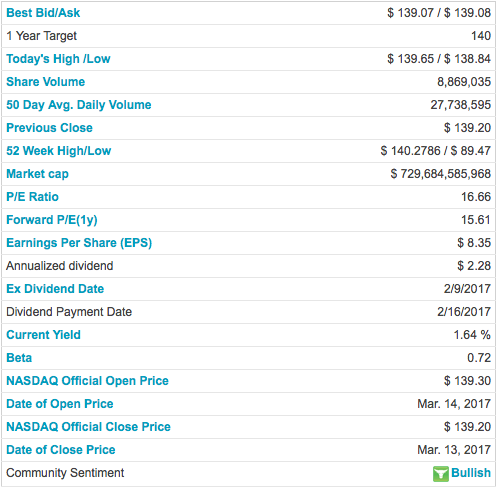
The stock price can be misleading, because there are actually TWO prices for each stock. The “bid” or price at which you can SELL the stock and the “ask” or price at which you can BUY the stock. The bid will always be lower than the ask (unless there's a computer glitch in the exchange). In our example with AAPL, the bid is $139.07 and the ask is $139.08. The difference between the bid and ask is called the bid/ask spread, or simply, the spread. The spread is currently $0.01
Bid/Ask Spread is a Trading Cost
One way stock exchanges make money is by capturing the bid/ask spread. In the case of AAPL, this is currently one cent per one stock. One cent may seem like an insignificant amount of money, but you need to consider that on an average day, almost 30 Million AAPL shares are bought and sold. This amounts to revenues of approximately $300,000 per day from a single stock, or $72 Million per year!
The more frequently you trade, the more often you will pay the bid/ask spread, which can decrease your profits over time. The bid/ask spread is one of the transaction costs that are important to keep in mind when trading.
Daily Price Change
Next to the stock price you will see a number with an arrow (0.1208) and a percentage next to that (0.09%). The number represents the dollar amount that the stock has changed for the day (as of the time you're looking at the stock quote). The arrow will signify whether the price has gone up or down. The percentage shows you the price change in percentage terms based on the closing price of the previous day.
Daily Price Range
The “Today's High/Low” row shows you the highest and lowest logged trading price for AAPL for today. One important thing to understand is that you could not have bought AAPL for less than $138.84 or sold AAPL for more than $139.65 during this day. These numbers currently define today's trading range for AAPL. However, the price can always move lower or higher than this range before the market closes.
Share Volume
This metric counts the amount of shares that are bought/sold throughout the day. Each transaction consists of a buyer and a seller for a specific amount of shares. For example, Alex buys 100 shares of AAPL from Lisa, who sells 100 shares of AAPL to Alex. This adds 100 to the total volume of AAPL for the day. In our example, the current volume is 8,869,035, which signifies the number of shares of AAPL that have traded on this day so far.
Previous Close
When the market closes, the stock price is assigned a closing price, which is the last price at which the stock was valued by the exchange. AAPL's last closing price was $139.20. From analyzing this value and the current price quote we can see that AAPL has dropped in price since the day before.
52 Week High/Low
This is another range which examines the price of a stock over a 52 week period. It identifies the highest and lowest price points during that timeframe. It's important to note that this measure tells us nothing about whether the stock has gone up or down or when those prices actually occurred. For AAPL, the lowest price during the last 52 weeks was $89.47 and the highest price was $140.2786. This means that the current price is very close to a 52-week high.
Market Capitalization
The market capitalization of a stock expresses the value of a company as the current value of its outstanding stock. Market capitalization is derived by multiplying the current stock value by the number of outstanding shares. In our example, AAPL's current market cap is $729,684,585,968. That's almost $730 Billion. This puts AAPL into the large-cap stock category. Large-cap stocks have a market capitalization of at least $5 Billion, but usually closer to $10 Billion or more. There are also mid-cap stocks, which have a market cap between $2-10 Billion, and small-cap stocks, which have a market cap between $300 Million - $2 Billion.
Profit-to-Earnings Ratio (P/E ratio)
A P/E ratio is a ratio derived from profits and earnings figures that the company releases publicly. The P/E ratio is widely used to compare similar stocks to one another. Some analysts use it to evaluate whether a particular stock might be underpriced or overpriced compared to similar stocks and market competitors. AAPL's current P/E ratio is 16.66. This number in isolation tells us very little. The value of this number can be derived from analyzing the historical trend of AAPL's P/E ratios and comparing AAPL's P/E to competitors' P/Es.
Earnings Per Share (EPS)
Earnings per share is another metric that measure's a portion of a company's profit allocated to each share of stock. This number tends to be an important factor in determining the stock's price. It is also used to calculate the E part of the P/E ratio. A simple formula for EPS = net income – dividends on preferred stock /(divided by) average outstanding shares.
Dividend, Dividend Payment Date and Current Yield
Some companies pay out dividends to their stock holders. Dividends are cash payments that are usually made on a quarterly basis. Companies who's stock carries a higher risk of ownership, tend to pay higher dividends to motivate investors to purchase or keep holding their stock. Companies that are less risky, like AAPL, tend to pay lower dividends. Some companies, like Amazon (AMZN), don't pay any dividends because they feel their investors would be better served by the company reinvesting their profits back into the company.
In our example, AAPL currently pays an annualized dividend of $2.28 per share. The dividend payment date, which is the date AAPL paid its last dividend, is 2/16/2017. The current yield is simply the dividend divided by the last closing price of the stock. In our example, this number is 1.64%. Notice that the current yield will change daily as the price of AAPL changes, but the dividend will not change unless AAPL chooses to announce a dividend increase or decrease.
It is important to know that companies are under no obligation to continue to pay dividends on their stock. They can suspend dividend payments at any time and this sometimes happens. Although, this usually is sign that the company is in fiscal trouble.
Beta
Beta is somewhat difficult to explain in detail, but you can think of beta as a stock's level of correlation to the broader market (usually the S&P 500). A beta of 1 implies that for every 1% move up or down in the stock market, the stock will also move 1% up or down. A beta of -1 implies a negative correlation with the stock market. If the S&P 500 moves up 1%, a stock with a beta of -1 will move down 1% and vice-versa. A stock with a beta of 3 will move 3% for every 1% move by the market.
Keep in mind that beta only shows us the historical correlations of stocks to the broader stock market. It tells us nothing about what might happen in the future. Some individuals use beta to build stock portfolios with the assumption that the beta relationships will stay relatively constant. This is a big mistake.
Market Sector
Stocks are assigned to different sectors depending on what their primary business activities are. Some examples of sectors include energy, utilities, technology, healthcare, financial, etc. AAPL is assigned to the technology sector. Sectors are important because they help to compartmentalize the 4,000+ companies that trade on the stock market and narrow the focus for analysis. Most individuals who trade professionally tend to excel in one or two sectors. It's very difficult to be extremely knowledgable about all sectors.
Conclusion
We've covered a lot of material in this blogpost, but this is the bare minimum that you need to understand to start trading intelligently in the stock market. No one said it was easy. My next finance post will focus on the stock market as a whole and explaining indexes and trading incentives (the psychology of markets/trading).
You should now be able to look up a company's stock price and perform a narrow analysis of the stock. I did not cover fundamental analysis in this post but will cover it in a future post.
I hope you were able to learn something new from this post and as always, I would love to hear your feedback below. Thanks for reading.